GoLand, a JetBrains IDE @GoLandIDE
@golang makes you love programming. We help keep that love alive. New features: #NewInGoLand Tips and tricks: #GoLandTip jetbrains.com/go JetBrains s.r.o. Joined October 2016-
Tweets1K
-
Followers11K
-
Following2
-
Likes603
We're heading to @gopherconeu next week! Stop by our booth to say hi, talk Go, and see what's new in GoLand. Looking forward to meeting the Go community in person 👋
SPONSOR POST Meet the team behind @GoLandIDE and chat about #Golang workflows, debugging, profiling, AI tooling, and the day-to-day challenges of building in Go. Stop by their booth to ask questions, and see what’s new in GoLand. Learn more 👉jetbrains.com/go/

`alloc` tells you where allocations are coming from over time. Use this parameter when your app creates too much garbage, even if memory is eventually freed. 🧵 2/2
`inuse` tells you what’s still alive on the heap. Check it when memory keeps growing, GC is overworked, or you suspect retained objects. 😎Pro tip: Force GC first before running a heap or allocs profile for the clearest view of currently live objects. 🧵 1/2
🔥Hot take: Heap and allocs are the same profile. They collect the same data. The only difference is the view they default to: 🔹Heap defaults to `inuse_space` (memory currently live). 🔹Allocs defaults to `alloc_space` (total memory allocated since startup). 🧵 0/2
CPU profiling does not tell you where time is spent waiting. If your service is slow because goroutines are blocked on locks, channels, I/O, or the network, then the CPU may look okay. Low CPU + high latency? Reach for block, mutex, or goroutine profiles. 🧵 1/1
A CPU profile samples active execution and shows hot paths: parsing, serialization, hashing, tight loops, or expensive business logic. Use it when your Go app is burning CPU or a benchmark is slower than expected – it’s a great first stop for CPU-bound performance problems. 🧵 0/1
@csandanov Hi there! Thank you for the question. Seems like it's Codex's built-in functionality. Please refer to github.com/openai/codex/i…
@yinebebt_ Hi! That dialog is from macOS. GoLand needs Screen Recording so the Color Picker eyedropper can read pixel colors on screen, no video is captured. 'Later' is fine, the IDE keeps working. We track the early prompt at youtrack.jetbrains.com/issue/IJPL-149…
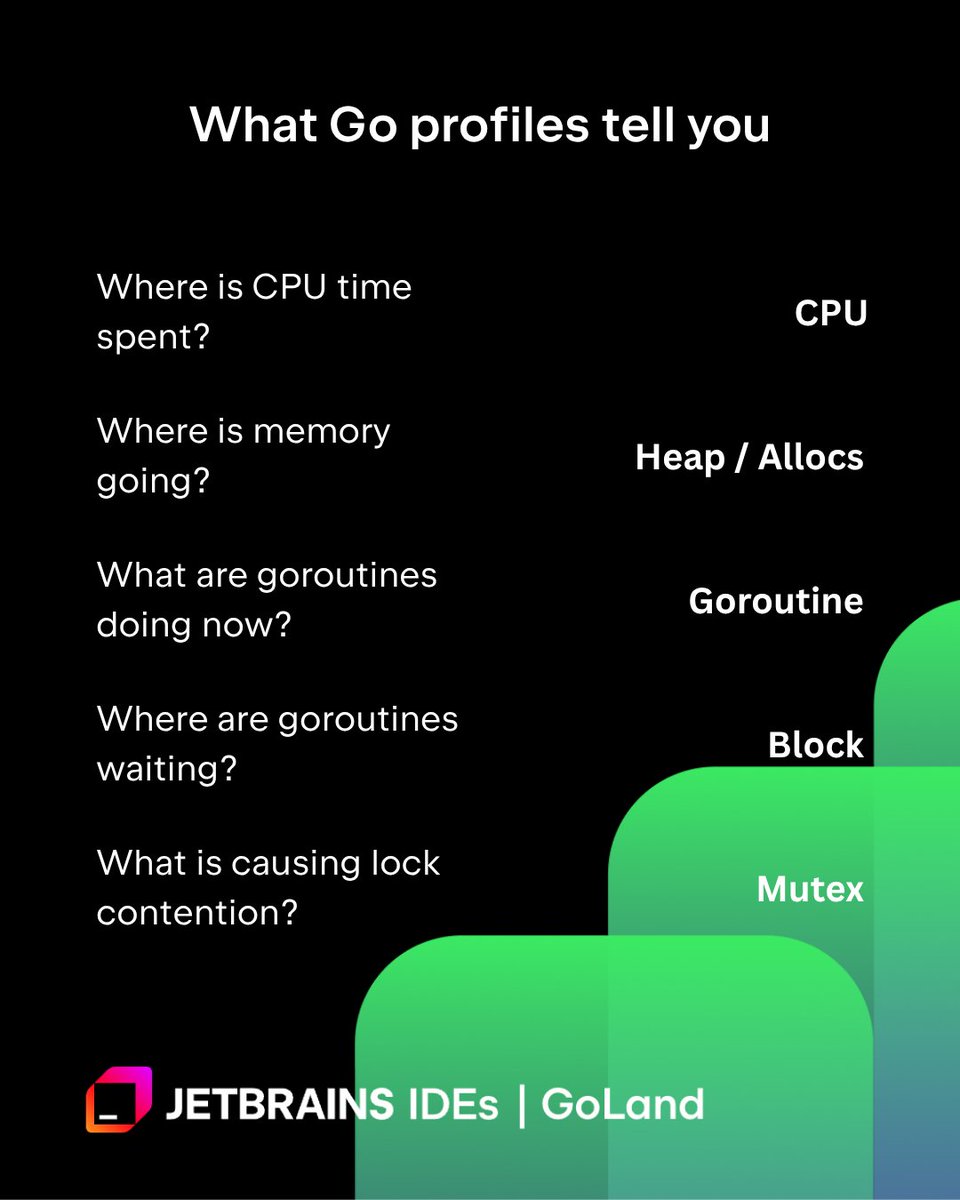
Different profiles answer different questions. Here’s a cheat sheet: 🔹 CPU: Where is the CPU time spent? 🔹 Heap/allocs: Where is memory going? 🔹 Block: Where are goroutines waiting? 🔹 Goroutine: What are goroutines doing right now? 🔹 Mutex: What is causing lock contention?
Here’s what happens when developers spend time in the playground, but not the one for writing Go code. How about you, have you been creative recently? Show us your art, we’d love to see it!


This might be more info than you'll ever need about @golang profiling, but this data is handy when you need to really explore software performance. This @jetbrains blog explains it, and shows why GoLand is a great IDE for Go devs ... blog.jetbrains.com/go/2026/05/20/…
No more switching between the web interface and your IDE – GoLand has it all in one place! Read more about our new profiling tool 👇 blog.jetbrains.com/go/2026/05/20/…
Whichever view you’re in, you can quickly navigate to the relevant line of code in your editor – just click on the function you’re interested in.
Exploring @golang profiles with GoLand is like exploring them with pprof’s web interface… but better! See what kinds of views are now available directly in your IDE 🧵
@chamodshehanka @GopherConSG Aw, thank you! We will let you all know when the recording is available, for sure.
At @GopherConSG, GoLand Engineering Lead Arseniy Terekhov gave a very well-received talk about teaching AI how to write modern Go. If you couldn’t attend but want to unlock that ✨ skill ✨, head over to our blog to learn how: blog.jetbrains.com/go/2026/02/20/…


JetBrains @jetbrains
213K Followers 54 Following On a mission to make software development a more productive and enjoyable experience. Make it happen. With Code.
IntelliJ IDEA, a JetB... @intellijidea
157K Followers 23 Following The Leading IDE for Pro Java and Kotlin Development, by @JetBrains Tips: #IntelliJIDEATips New Features: #NewInIntelliJIDEA Our YT channel https://t.co/GuAlWUIi7Q
Cool Go @cool_golang
12K Followers 107 Following Auto-retweeting cool Go stuff from accounts I’m following. Propose accounts to follow in DM.
WebStorm, a JetBrains... @WebStormIDE
30K Followers 20 Following The JavaScript and TypeScript IDE, by @JetBrains Tips and tricks: #WebStormTip New features: #NewInWebStorm
Matt Boyle @MattJamesBoyle
15K Followers 4K Following Head of Product, Design & Engineering @ona_hq. previously ran Dev Ex @cloudflare. @golang fan boy.

Teiva Harsanyi @teivah
6K Followers 204 Following 💻 Software engineer, building Distributed Cloud @Google ✍ The Coder Cafe newsletter https://t.co/7HSYPInAaW 📖 100 Go Mistakes author https://t.co/SydmmockD1
Jon Calhoun @joncalhoun
11K Followers 404 Following Teaching #golang & building fun projects • Want to learn Go? Try https://t.co/qYoY2xodvd and https://t.co/m5PyRJbIY3

Ehliman Şen @EhlimanSen
230 Followers 1K Following Meraklı, Kova Burcu, Bilgisayar Kurdu, Espresso Delisi, hayalperest, dakik, sır küpü, kitap sever, her zaman olmuşken iyisi olsun diyenlerden (-:
Rhetxh @rhetxh30265
9 Followers 398 Following
Aldo Brooks @JoseRod1042620
3 Followers 89 Following

Kawser Ahmed @EngrKawser47
0 Followers 27 Following Senior Software Engineer | Go, PHP & JavaScript | Microservices, Docker & Full-Stack Development | Developing Scalable Systems | Driving Reliability & Performan

GuacSenpai @GuacSenpai
65 Followers 345 Following
Emmanuel @eedm268
18 Followers 101 Following

JHom @LLHomJJ
20 Followers 1K Following
Harsh Rastogi @0xharshrastogi
99 Followers 493 Following Senior Engineer @Blockdaemon I build blockchain infra for a living I think in systems, not trends Tech • Money • Life
LyoneeL(🇦🇷) @lyoneel
44 Followers 586 Following Self-proclaimed "Factorio Rail Master". Developer, gamer, tech explorer, writer (?) or something like.


Override @TstdTomson
4 Followers 223 Following
CΔrTh @_c4rth_
13 Followers 177 Following
Leeseo @leeseoimnida
8 Followers 143 Following
Alex Monte @alexhmonte
75 Followers 264 Following Just a software engineer always looking for better ways to make better software 👨🏻💻.
Jean @christian_art_b
5 Followers 354 Following


Omar A. Alani @omarluqq
35 Followers 462 Following Founder & CEO @ZuneshaAI Building Infrastructure for the Agentic Era join the wait list 👉 https://t.co/4WLZYn4A7s
Alejandro Pozo Megret @Alex_P00L
1 Followers 47 Following
Luka Parezanovic @LukaPareza60217
0 Followers 24 Following
Mohamed 👨🏻�... @m_assaleh1
22 Followers 378 Following ﷽ MSc Computer Science @TUBerlin | IT Student Assistant @Siemens | Lifelong passion for tech & innovation 💻🚀
ZETTABYTE @ZByte16
33 Followers 364 Following I'll show people the love of Christ through amazing videogames. 👊
Andrea Berardi @AndreaBerardi0
16 Followers 659 Following
Golang Boss @GolangBoss
2 Followers 17 Following Go tips • Linux hacks • Backend patterns • Building SaaS
Jason B Burgess @JasonBBurgnmsu
0 Followers 53 Following
L c @ljceranic
0 Followers 531 Following
Michael Brennan @MichaelBrenps2
1 Followers 281 Following

Nathan Nutter @ByggeData
3 Followers 137 Following


Emre Sarıpınar @emreesaripinar
2 Followers 249 Following
RAHUL T @RAHULT1738647
1 Followers 10 Following
infybtw @iinfybtw
2 Followers 28 Following


Dennis Hanchar @dennis_hanchar
190 Followers 1K Following Computer Systems Integrator / Computer Tech. (30 years) IBM, Quebec Banks ( National, Desjardin), Sureter du Quebec Hydro Quebec Love: Canada, People & Nature
godin @godindev_
2 Followers 221 Following
hanna hrayki @hannahrayki
1 Followers 234 Following
JetBrains @jetbrains
213K Followers 54 Following On a mission to make software development a more productive and enjoyable experience. Make it happen. With Code.You might like