
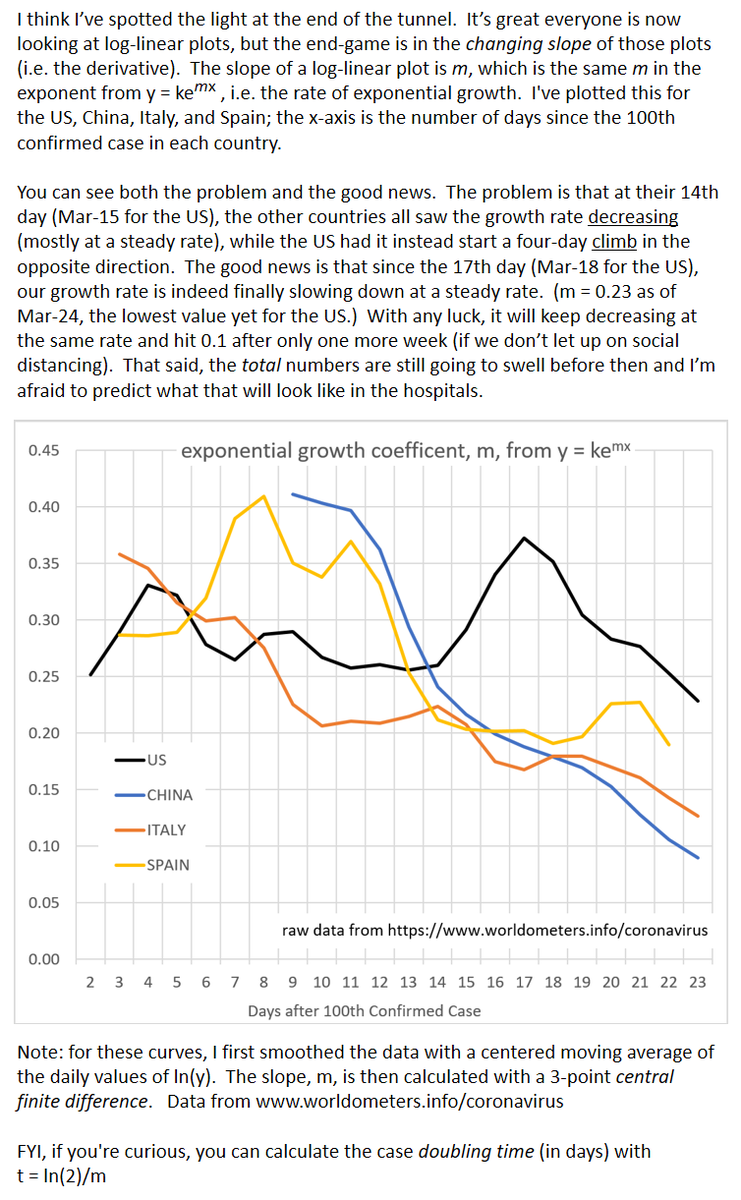
Have I spotted the light at the end of the tunnel? Here's a plot of the changing growth rate of confirmed COVID cases in the US, China, Italy, and Spain; the x-axis is the number of days since the 100th confirmed case in each country. Observe the US trend after our 17th day.
1
1
1
0
0
Download Image
