Search results for #kernelDebugging

🛠️ Ready to reverse security products at the kernel level? Mar 11, see what’s inside SEC665 with a live lab demo from Jonathan Reiter. 📅 2:30PM ET 🔗 go.sans.org/msyoQW #SEC665 #RedTeam #KernelDebugging


War story: 0x9F DRIVER_POWER_STATE_FAILURE fixed by !poaction + !devnode. Screenshot your !analyze -v and the blocking IRP. What’s your fastest path to the bad stack? Reply with your triage flow! #WindowsDebugging #WinDBG #KernelDebugging
📢 Missed the webcast? It’s now OnDemand! Walk through Jonathan Reiter's new kernel debugging, compiler intrinsics & Windows internals poster. 📺 Watch now: 🔗 sans.org/u/1AJW #OnDemand #RedTeam #KernelDebugging #SEC670

Want a clearer path to kernel debugging? Tomorrow, Jonathan Reiter breaks down remote debugging & C++ techniques from his new SANS poster. 📅 April 7 | 3:30 PM EDT 🔗 sans.org/u/1AJW #KernelDebugging #RedTeam #SEC670

🛠️ Learn to set up remote kernel debugging, write C++ with compiler intrinsics & work efficiently with Windows internals. 📅 April 7, 3:30 PM EDT 🔗 sans.org/u/1AJW #RedTeam #KernelDebugging #SEC670

Red teamers, Windows devs, and reverse engineers—this webcast is for you. Join Jonathan Reiter on April 7 for a walkthrough of practical kernel debugging tips you can actually use. 📅 April 7 | 3:30 PM EDT 🔗 sans.org/u/1AJW #RedTeam #KernelDebugging #WindowsInternals
Working with Windows internals? Join Jonathan Reiter on April 7 for a walkthrough of his new poster on remote kernel debugging & C++ compiler intrinsics. 🔗 sans.org/u/1AJW #RedTeam #KernelDebugging #SEC670

🛠️ New SANS Kernel Debugging poster! Essential WinDbg commands, function hooking, system call insights, and more—all in one reference. 📥 Download now: sans.org/posters/compre… #KernelDebugging #WinDbg #CyberSecurity
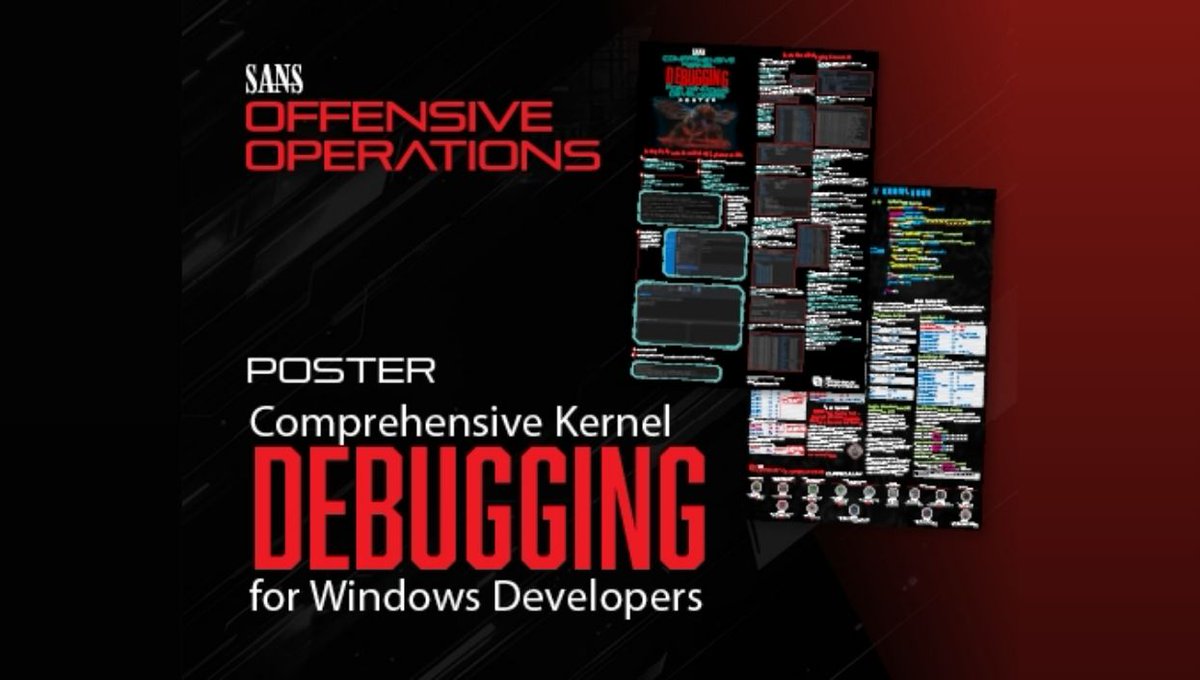
The Comprehensive Kernel Debugging for Windows Developers poster is here! Get step-by-step guidance on WinDbg, function hooking, system calls, and more—a must-have for security pros & researchers. 📥 Download now: sans.org/posters/compre… #KernelDebugging #WinDbg

19/20 Q: What is 'kdump' in Linux, and how does it aid in kernel debugging? A: 'kdump' is a mechanism that captures kernel crash dumps when a system experiences a kernel panic. It helps in post-mortem analysis to diagnose and fix kernel issues. #Kdump #KernelDebugging
15/20 Q: Explain 'strace' & 'gdb' in the context of kernel troubleshooting. A: 'strace' traces system calls, while 'gdb' is a debugger for user-space processes. In kernel troubleshooting, tools like 'ftrace' & 'kgdb' are used for kernel-level debugging. #KernelDebugging
Finally! It is here, my copy just arrived and I’m excited! #WindowsInternals #PerformanceRules #KernelDebugging

What _EPROCESS & Process Environment Block? Windows Process Internals : A few Concepts to know before jumping on Memory Forensics by imp hash link.medium.com/HjMC0D67x8 #WindowsInternals #KernelDebugging
The I/O Manager interaction with device drivers #DebugModeOn #KernelDebugging #WinDBG


!storloglist is awesome! #kernelDebugging @WindowsInternals #StorPortRaidLogList
Thread States Diagram #WinDBG #Debugging #KernelDebugging #WindowsInternals

Extending windbg with Page Fault Breakpoints - CodeProject - codeproject.com/Articles/18623… #WinDBG #Debug #KernelDebugging
Top 10 Kernel Debugging Tricks Video: codemachine.com/article_kernel… #WindowsInternals #WinDBG #kernelDebugging #DebugModeOn
Part 3: Understanding !PTE – Non-PAE and X64 blogs.msdn.microsoft.com/ntdebugging/20… #WindowsInternals #KernelDebugging #WinDBG #DebugModeOn #Debug